
前回

の続き。
今回はグラフ描画のサンプルを貼っていく。
広告
サンプル1:直線と曲線
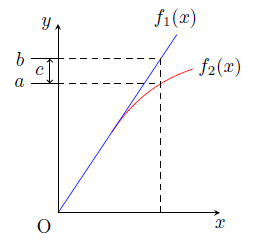
\begin{figure}[h]
\centering
\begin{tikzpicture}

\draw[-stealth](-1,-1.5)--(-1,2)node[left]{$y$};
\draw[-stealth](-1,-1.5)--(2,-1.5)node[below]{$x$};
\draw(-1,-1.5)node[below left]{O};

\draw [domain=-1:1.2,blue] plot[smooth](\x, 1.5*\x);
\draw(1.6,2)node[left]{$f_{1}(x)$};

\draw [domain=0:1.5,red] plot[smooth](\x, {1.5-1.5*exp(-\x)});
\draw(1.8,1.3)node{$f_{2}(x)$};

\draw[dashed](-1,1.35)--(0.9,1.35);
\draw[dashed](-1,0.9)--(0.9,0.9);
\draw[dashed](0.9,1.35)--(0.9,-1.5);

\draw(-1,1.35)--(-1.5,1.35)node[left]{$b$};
\draw(-1,0.9)--(-1.5,0.9)node[left]{$a$};

\draw[<->](-1.15,1.35)--(-1.15,0.9);
\draw(-1.15,1.125)node[left]{$c$};

\end{tikzpicture}
\end{figure}
サンプル2:曲線1
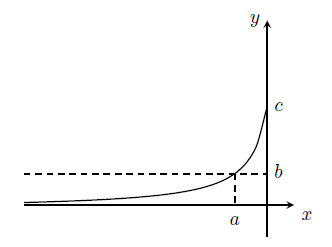
\begin{figure}[h]
\centering
\begin{tikzpicture}

\draw[-stealth](-4.5,0.08) -- (0.5,0.08) node[below right]{$x$};
\draw[-stealth](0,-0.5) -- (0,3.5) node[left]{$y$};

\draw [domain=-4.5:0] plot[smooth](\x, {-1/(exp{0.5*(\x+0.29)-1})});

\draw [dashed] (-0.6,0.65)--(-0.6,0.08);
\draw (-0.6,0) node[below]{$a$};

\draw [dashed] (-4.5,0.65)--(0,0.65);
\draw (0,0.7) node[right]{$b$};

\draw (0,1.9) node[right]{$c$};

\end{tikzpicture}
\end{figure}
サンプル3:曲線2
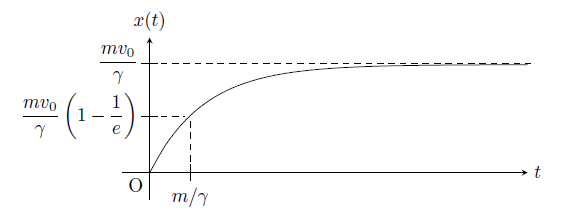
\begin{figure}[h]
\centering
\begin{tikzpicture}

\draw [-stealth](-0.5,0)--(7,0) node [right]{$t$};
\draw [-stealth](0,-0.5)--(0,2.5) node [above]{$x(t)$};
\draw (0,0) node[below left]{O};

\draw [domain=0:7] plot[smooth](\x, {2-2*exp(-\x)});

\draw [dashed](0,2.02)--(7.05,2.02);
\draw (-0.15,2.02) -- (0.15,2.02);
\draw (-0.1,2) node [left]{$\displaystyle{\frac{mv_0}{\gamma}}$};

\draw [dashed](0,1.04)--(0.65,1.04);
\draw (-0.15,1.04) -- (0.15,1.04);
\draw (-0.1,1.04) node [left]{$\displaystyle{\frac{mv_0}{\gamma}\left(1-\frac{1}{e}\right)}$};

\draw [dashed](0.75,0)--(0.75,1.05);
\draw (0.75,-0.15) -- (0.75,0.15);
\draw (0.75,-0.15) node[below]{$m/\gamma$};

\end{tikzpicture}
\end{figure}
サンプル4:曲線3

\begin{figure}[h]
\centering
\begin{tikzpicture}

\draw [-stealth](-0.5,0)--(5,0) node [right]{$t$};
\draw [-stealth](0,-2.5)--(0,2.5) node [above]{$y(t)$};
\draw (0,0) node[below left]{O};

\draw [domain=0:4] plot[smooth](\x, {6-4*exp(-\x/2)-2*\x});

\draw (-0.15,2) -- (0.15,2);
\draw (-0.1,2) node [left]{$h$};

\draw [dashed](0,0.95)--(1.65,0.95);
\draw (-0.15,0.95) -- (0.15,0.95);
\draw (-0.1,0.95) node [left]{$\displaystyle{h-\frac{m^{2}g}{{\gamma}^{2}e}}$};

\draw [dashed](1.65,0)--(1.65,1);
\draw (1.65,-0.15) -- (1.65,0.15);
\draw (1.65,-0.15) node[below]{$m/\gamma$};

\end{tikzpicture}
\end{figure}
サンプル5:曲線4
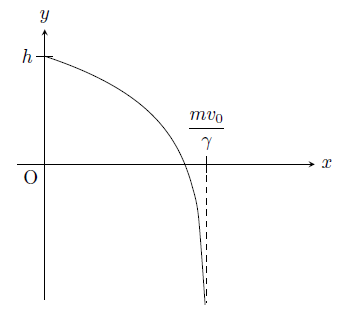
\begin{figure}[h]
\centering
\begin{tikzpicture}

\draw [-stealth](-0.5,0)--(5,0) node [right]{$x$};
\draw [-stealth](0,-2.5)--(0,2.5) node [above]{$y$};
\draw (0,0) node[below left]{O};

\draw [domain=-3:-0.03] plot[smooth]({\x+3}, {ln(-\x)+0.905});

\draw (-0.15,2) -- (0.15,2);
\draw (-0.1,2) node [left]{$h$};

\draw [dashed](3,0)--(3,-2.55);
\draw (3,-0.15) -- (3,0.15);
\draw (3,0.15) node [above]{$\displaystyle{\frac{mv_0}{\gamma}}$};

\end{tikzpicture}
\end{figure}
サンプル6:正弦波1
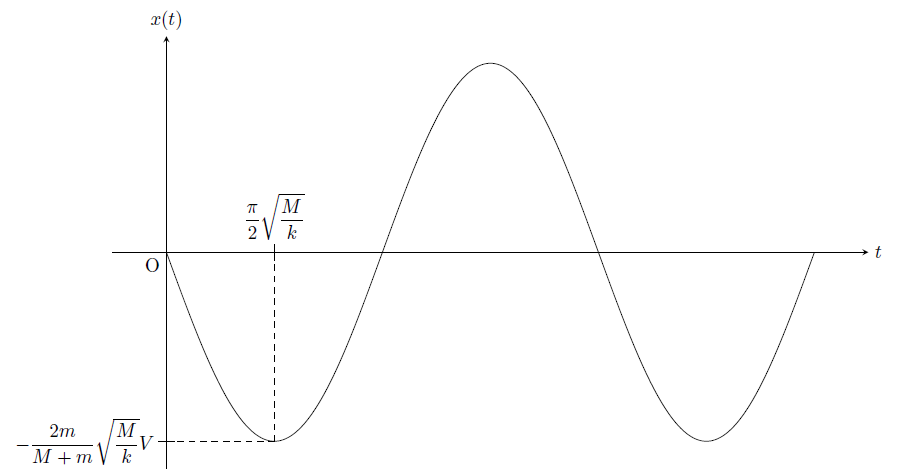
\begin{figure}[h]
\centering
\begin{tikzpicture}

\draw[-stealth](-1,0) -- (13,0) node[right]{$t$};
\draw[-stealth](0,-4) -- (0,4) node[above]{$x(t)$};
\draw (0,0) node[below left]{O};

\draw (0,0) sin (2,-3.5) cos (4,0) sin (6,3.5) cos (8,0) sin (10,-3.5) cos (12,0);

\draw[dashed](0,-3.5)--(2.05,-3.5);
\draw (-0.15,-3.5)--(0.15,-3.5);
\draw (-0.1,-3.5) node[left]{$\displaystyle{-\frac{2m}{M+m}\sqrt{\frac{M}{k}}V}$};

\draw[dashed](2,-3.5)--(2,0.1);
\draw (2,-0.15)--(2,0.15);
\draw (2,0.1) node[above]{$\displaystyle{\frac{\pi}{2}\sqrt{\frac{M}{k}}}$};

\end{tikzpicture}
\end{figure}
サンプル7:正弦波2
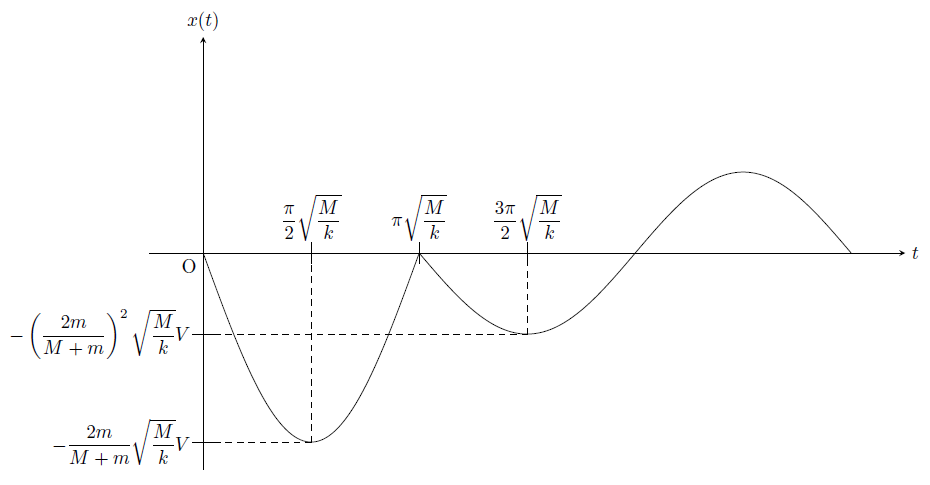
\begin{figure}[h]
\centering
\begin{tikzpicture}

\draw[-stealth](-1,0) -- (13,0) node[right]{$t$};
\draw[-stealth](0,-4) -- (0,4) node[above]{$x(t)$};
\draw (0,0) node[below left]{O};

\draw (0,0) sin (2,-3.5) cos (4,0);
\draw (4,0) sin (6,-1.5) cos (8,0) sin (10,1.5) cos (12,0);

\draw[dashed] (2,-3.5)--(2,0);
\draw (2,-0.2)--(2,0.2);
\draw (2,0.1) node[above]{$\displaystyle{\frac{\pi}{2}\sqrt{\frac{M}{k}}}$};

\draw (4,-0.2)--(4,0.2);
\draw (4,0.1) node[above]{$\displaystyle{\pi\sqrt{\frac{M}{k}}}$};

\draw[dashed] (6,-1.5)--(6,0);
\draw (6,-0.2)--(6,0.2);
\draw (6,0.1) node[above]{$\displaystyle{\frac{3\pi}{2}\sqrt{\frac{M}{k}}}$};

\draw[dashed] (0,-3.5)--(2.05,-3.5);
\draw (-0.2,-3.5)--(0.2,-3.5);
\draw (-0.1,-3.5) node[left]{$\displaystyle{-\frac{2m}{M+m}\sqrt{\frac{M}{k}}V}$};

\draw[dashed] (0,-1.5)--(6.05,-1.5);
\draw (-0.2,-1.5)--(0.2,-1.5);
\draw (-0.1,-1.5) node[left]{$\displaystyle{-\left(\frac{2m}{M+m}\right)^2\sqrt{\frac{M}{k}}V}$};

\end{tikzpicture}
\end{figure}
広告
終わりに
グラフ編はここで終了。
次は座標上の図形のサンプルを紹介しようと思う。
次回はこちら。
広告
コメント