TikZとはLaTeXで利用できる描画コマンド群である。
LaTeXのエディタ上でTikZのコマンドを打ち込み、読み込ませることで様々な図形を描画することが出来る。
今回は具体的な使い方やコマンドの種類の解説は書籍等に任せ、私が実際にTikZで描画した図をサンプルとして公開する。
TikZでの図形描画の一助になれば幸いだ。
まずは比較的シンプルな図形のサンプルから。
広告
サンプル1:方形

\begin{figure}[h]
\centering

\begin{minipage}{0.3\columnwidth}
\centering
\begin{tikzpicture}[thick]
\fill [blue!20!orange!70!](0,0)rectangle(4,2);
\draw [line width=2pt](0,0)rectangle(4,2);
\end{tikzpicture}
\end{minipage}

\begin{minipage}{0.3\columnwidth}
\centering
\begin{tikzpicture}[thick]
\fill [blue!20!](0,0) rectangle (2,2);
\draw [line width=2pt](0,0) rectangle (2,2);
\fill [orange!70!](2,0) rectangle (4,2);
\draw [line width=2pt](2,0) rectangle (4,2);
\end{tikzpicture}
\end{minipage}

\begin{minipage}{0.3\columnwidth}
\centering
\begin{tikzpicture}[thick]
\fill [blue!20!](0,0) rectangle (4/3,2);
\draw [line width=2pt](0,0) rectangle (4/3,2);
\fill [yellow](4/3,0) rectangle (8/3,2);
\draw [line width=2pt](4/3,0) rectangle (8/3,2);
\fill [red!70!](8/3,0) rectangle (4,2);
\draw [line width=2pt](8/3,0) rectangle (4,2);
\end{tikzpicture}
\end{minipage}
\end{figure}
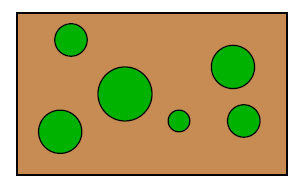
サンプル2:方形と円

\begin{figure}[h]
\centering
\begin{tikzpicture}[thick]
\draw[fill=brown!90](0,0)rectangle(5,3);
\draw[fill=black!30!green](2,1.5)circle(0.5);
\draw[fill=black!30!green](3,1)circle(0.2);
\draw[fill=black!30!green](4,2)circle(0.4);
\draw[fill=black!30!green](1,2.5)circle(0.3);
\draw[fill=black!30!green](0.8,0.8)circle(0.4);
\draw[fill=black!30!green](4.2,1)circle(0.3);
\end{tikzpicture}
\end{figure}
サンプル3:方形の二つ折り

\begin{figure}[h]
\centering
\begin{tikzpicture}

\fill[black!20](0,0)--(0,5)--(-1,4)--(-1,-1)--cycle;
\fill[black!20](0,0)--(2.5,-0.5)--(2.5,4.5)--(0,5);

\draw[line width=1.5pt](0,0)--(0,5)--(-1,4)--(-1,-1)--cycle;
\draw[line width=1.5pt](0,0)--(2.5,-0.5)--(2.5,4.5)--(0,5);

\draw(0,5)--(0,5.5);
\draw(2.5,4.5)--(2.5,5);
\draw[latex-latex](2.5,4.5+0.25)--(0,5+0.25);
\draw(1.25,5)node[above]{$A$};

\draw(2.5,-0.5)--(3,-0.5);
\draw(2.5,4.5)--(3,4.5);
\draw[latex-latex](2.75,-0.5)--(2.75,4.5);
\draw(2.75,2)node[right]{$B$};

\draw[latex-latex](-0.2,-0.2)to[out=315, in=225](0.75,-0.15);
\draw(0.25,-0.4)node[below]{$\alpha$};

\end{tikzpicture}
\end{figure}
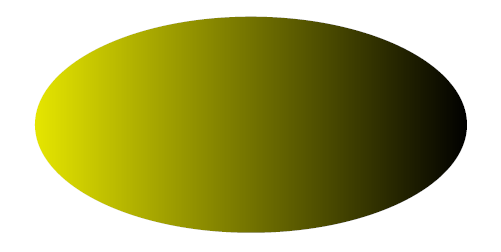
サンプル4:グラデーションつき楕円

\begin{figure}[h]
\centering
\begin{tikzpicture}[thick]
\shade[left color=black!10!yellow, right color=black](0,0)ellipse(4 and 2);
\end{tikzpicture}
\end{figure}
広告
終わりに
図形編はここで終了。
次はグラフ描画のサンプルを紹介したいと思う。
次回はこちら。
広告


コメント